
Android NDK, GDB, and Bus Errors
So there I was, trying out some existing C/++ code on Android for the first time, when:
The first step, as always, is logcat. If you’re filtering the output to messages originating from your application, you’ll see something like this:
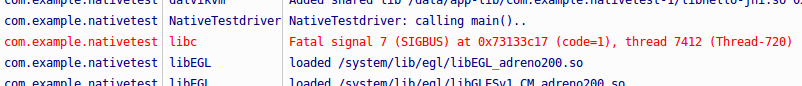
SIGBUS – this is a bus error. I caused a few of these as I learned C/++ on SPARC machines at Purdue. Disable the log filter and you get a good deal more information, including processor state and a stack trace:
Build fingerprint: 'google/occam/mako:4.3/JWR66Y/776638:user/release-keys'
Revision: '11'
pid: 14941, tid: 14982, name: Thread-1180  >>> com.example.nativetest <<<
signal 7 (SIGBUS), code 1 (BUS_ADRALN), fault addr 74c18c17
    r0 00000001  r1 74c18c34  r2 c8c0476d  r3 74c18c17
    r4 6d6e3878  r5 74165e98  r6 00000004  r7 74b18fd8
    r8 74c18c48  r9 74b18fd0  sl 74165ea8  fp 74c18c24
    ip 00000003  sp 74c18c10  lr 73056bb0  pc 730573c4  cpsr 600f0010
    d0  616d20676e696c69  d1  6163203a7265766e
    d2  6d3e82086d3e8128  d3  6d3e82786d3e8229
    d4  6d3ecbb86d3ecb80  d5  6d3ecc286d3ecbf0
    d6  6d3ecc986d3ecc60  d7  6d3ecd086d3eccd0
    d8  0000000000000000  d9  0000000000000000
    d10 0000000000000000  d11 0000000000000000
    d12 0000000000000000  d13 0000000000000000
    d14 0000000000000000  d15 0000000000000000
    d16 00001af3a10853bf  d17 ffffffffffb3b4c0
    d18 0002000000020001  d19 0006000500040003
    d20 3fde8ba2e8ba2e8c  d21 401e1745e0000000
    d22 401e1745e0000000  d23 4028000000000000
    d24 0008000700060004  d25 000a0008000a0009
    d26 0000000000000000  d27 0000000000000000
    d28 3ff0000000000000  d29 0000000000000000
    d30 000a000a000a000a  d31 0000000000000000
    scr 60000012

backtrace:
    #00  pc 000063c4  /data/app-lib/com.example.nativetest-1/libhello-jni.so (main+24)
    #01  pc 00005bac  /data/app-lib/com.example.nativetest-1/libhello-jni.so (Java_com_example_nativetest_MainActivity_doStuffC+68)
    #02  pc 0001dc4c  /system/lib/libdvm.so (dvmPlatformInvoke+112)
    #03  pc 0004decf  /system/lib/libdvm.so (dvmCallJNIMethod(unsigned int const*, JValue*, Method const*, Thread*)+398)
    #04  pc 0004f8bd  /system/lib/libdvm.so (dvmResolveNativeMethod(unsigned int const*, JValue*, Method const*, Thread*)+184)
    #05  pc 00027060  /system/lib/libdvm.so
    #06  pc 0002b5ec  /system/lib/libdvm.so (dvmInterpret(Thread*, Method const*, JValue*)+184)
    #07  pc 0005ff21  /system/lib/libdvm.so (dvmCallMethodV(Thread*, Method const*, Object*, bool, JValue*, std::__va_list)+292)
    #08  pc 0005ff4b  /system/lib/libdvm.so (dvmCallMethod(Thread*, Method const*, Object*, JValue*, ...)+20)
    #09  pc 00054ccb  /system/lib/libdvm.so
    #10  pc 0000ca58  /system/lib/libc.so (__thread_entry+72)
    #11  pc 0000cbd4  /system/lib/libc.so (pthread_create+208)
...
For this contrived example, the backtrace is enough information to track down the problem. It points us to the function ( main() ), which can then be inspected for suspicious code:
#include <stdint.h>
void main(){
	uint8_t foo;
	uint64_t bar = *((uint64_t *) &foo);
}
In a real application you’re likely to need more information; I took this opportunity to try GDB with Android.
GDB
The NDK comes with a convenient helper script called ndk-gdb. It has some capacity to launch your app for you (and breakpoint early in execution), but I don’t need that today – my crash doesn’t occur until after user interaction. First I launch the app (which is just a tiny piece of java code that calls my native main() via JNI), then run ndk-gdb from the project directory, and …
jruble@jruble-linux:~/NativeTest$ ndk-gdb
ERROR: Could not extract package's data directory.
Are you sure that your installed application is debuggable?
It took a little while to figure this one out, given that this was my first time using gdb with an Android device. It turns out that ndk-gdb is broken on Android 4.3 due to a broken run-as command (bug). You may be able to work around it with root (stackoverflow); I just plugged in a 4.2.2 device. (update: it’s fixed in 4.4)
Here’s what should happen:
jruble@jruble-linux:~/NativeTest$ ndk-gdb
GNU gdb (GDB) 7.3.1-gg2
Copyright (C) 2011 Free Software Foundation, Inc.
License GPLv3+: GNU GPL version 3 or later <http://gnu.org/licenses/gpl.html>
This is free software: you are free to change and redistribute it.
There is NO WARRANTY, to the extent permitted by law. Type "show copying"
and "show warranty" for details.
This GDB was configured as "--host=x86_64-linux-gnu --target=arm-linux-android".
For bug reporting instructions, please see:
<http://source.android.com/source/report-bugs.html>.
warning: Could not load shared library symbols for 78 libraries, e.g. libstdc++.so.
Use the "info sharedlibrary" command to see the complete listing.
Do you need "set solib-search-path" or "set sysroot"?
warning: Breakpoint address adjusted from 0x4014fb13 to 0x4014fb12.
0x400edf00 in epoll_wait () from /home/jruble/NativeTest/obj/local/armeabi-v7a/libc.so
(gdb)
It stops with a SIGTRAP in epoll_wait(). I’m not sure why – perhaps this is a convenience mechanism to automatically break when you attach a debugger.
(gdb) info program
Debugging a target over a serial line.
Program stopped at 0x400edf00.
It stopped with signal SIGTRAP, Trace/breakpoint trap.
(gdb) bt
#0 0x400edf00 in epoll_wait () from /home/jruble/NativeTest/obj/local/armeabi-v7a/libc.so
#1 0x40211b2c in ?? ()
#2 0x40211b2c in ?? ()
Backtrace stopped: previous frame identical to this frame (corrupt stack?)
(gdb)
Anyway, continuing..
(gdb) continue
Continuing.
I now perform the action that causes the crash.
[New Thread 28299]

Program received signal SIGBUS, Bus error.
[Switching to Thread 28299]
0x4fe473c4 in main () at /home/jruble/svn/tools/android_native_driver/NativeTest/jni/staticlib/sigbus.c:5
5	   uint64_t bar = *((uint64_t *) &foo);
Must go deeper..
(gdb) disas /m main
Dump of assembler code for function main:
3	void main(){
0x4fe473ac <+0>:	push	{r11}		; (str r11, [sp, #-4]!)
0x4fe473b0 <+4>:	add	r11, sp, #0
0x4fe473b4 <+8>:	sub	sp, sp, #20

4	   uint8_t foo = 123;//[8] = {1,2,3,4,5,6,7,8};
0x4fe473b8 <+12>:	mov	r3, #123	; 0x7b
0x4fe473bc <+16>:	strb	r3, [r11, #-13]

5	   uint64_t bar = *((uint64_t *) &foo);
0x4fe473c0 <+20>:	sub	r3, r11, #13
=> 0x4fe473c4 <+24>:	ldrd	r2, [r3]
0x4fe473c8 <+28>:	strd	r2, [r11, #-12]

6	}
0x4fe473cc <+32>:	sub	sp, r11, #0
0x4fe473d0 <+36>:	pop	{r11}		; (ldr r11, [sp], #4)
0x4fe473d4 <+40>:	bx	lr

End of assembler dump.
Here we can see that the offending line is a load double-word instruction (ldrd), which presumably has an alignment requirement. What’s the address?
(gdb) print /x $r3
$1 = 0x5406dc1f
So there’s the problem: 0x5406dc1f % 4 == 3. Assuming you have a good reason to point a uint64* at a uint8, make sure you only do it in a word-aligned way.
Miscellaneous
Linux is actually able to trap and emulate (“fix up”) offending unaligned accesses. You can control this behavior with /proc/cpu/alignment. (wiki.debian) My Android device can be configured with the forgiving kernel-fixes-your-mistakes behavior, but it makes sense that this is disabled by default: it’s likely very expensive.
On my device, LDRD instruction operands need only be word-aligned, not doubleword-aligned; i.e. the addresses must divide by 4, but they need not divide by 8.
My case only seems to happen with NDK Makefile configuration NDK_TOOLCHAIN_VERSION=4.8 and APP_OPTIM := debug; use clang or optimization and it goes away.

